A feasibility study fails when it is built on a supplier’s best week. Hydroponic yield per square metre is not a single figure a farm can copy into a spreadsheet — it is a planning range that holds only under stated conditions of climate, cultivar, season and management. The numbers below are the ranges used for early-stage commercial work, with the assumption written beside each one. They are starting points for a bankable model, to be replaced with local trial data as soon as the farm has it.
Why a feasibility study needs ranges, not promises
Investors and lenders test the downside, not the average. A model with one yield number hides the two questions they will ask: what happens in the worst case, and what has to be true for the best case. Low, base and high cases, each with visible assumptions, are what make a model survive review.
Hydroponic yield per square metre depends entirely on which square metre is being counted. Yield over growing area and yield over greenhouse structure are different numbers, and confusing them is the most common error in early feasibility work. Aisles, headlands, propagation, packing and service space all sit inside the structure; many layouts land in the range of roughly 70–85% growing area as a planning assumption, but the figure has to come from the layout drawing.
Then separate harvested yield from sold yield. Packout losses from grading, pest damage, tipburn or transport reduce marketable kilograms, and a model that ignores them overstates revenue by the whole margin in many cases.
Yield ranges by crop and system
The ranges below are planning figures for a well-run commercial site, expressed per square metre of growing area per year, with the crop turn or cycle count stated. Each one assumes the crop is grown in the system it suits and that the climate control matches the crop’s requirement.
| Crop | System | Planning range (kg/m²/yr) | Assumptions the figure depends on |
|---|---|---|---|
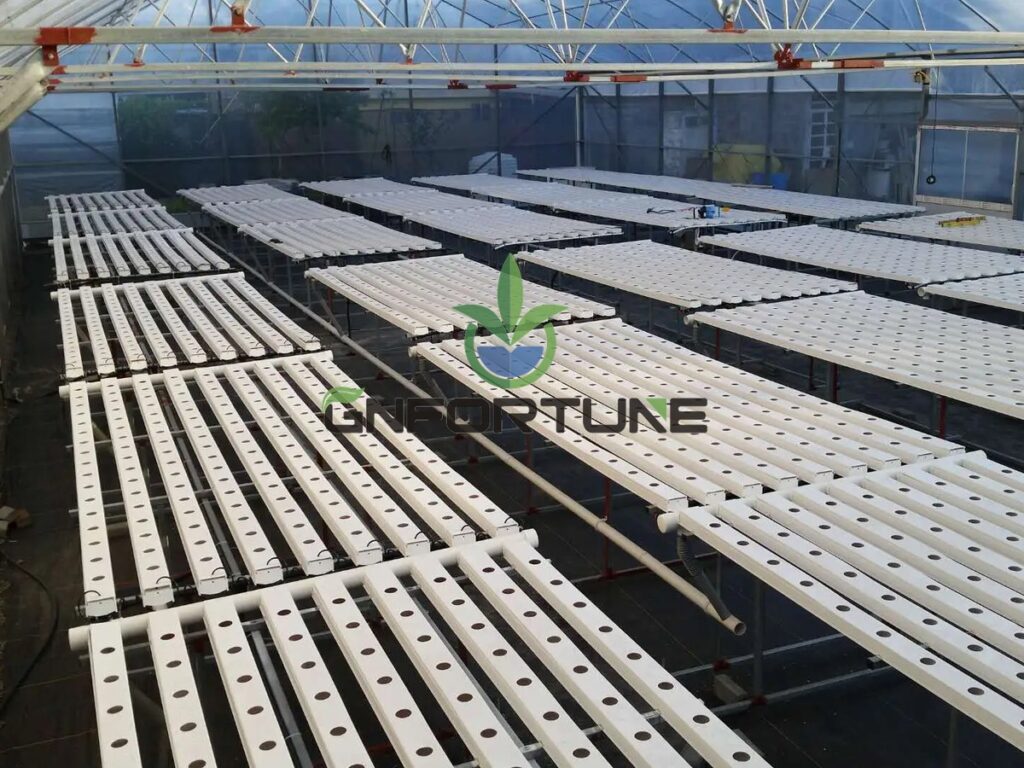
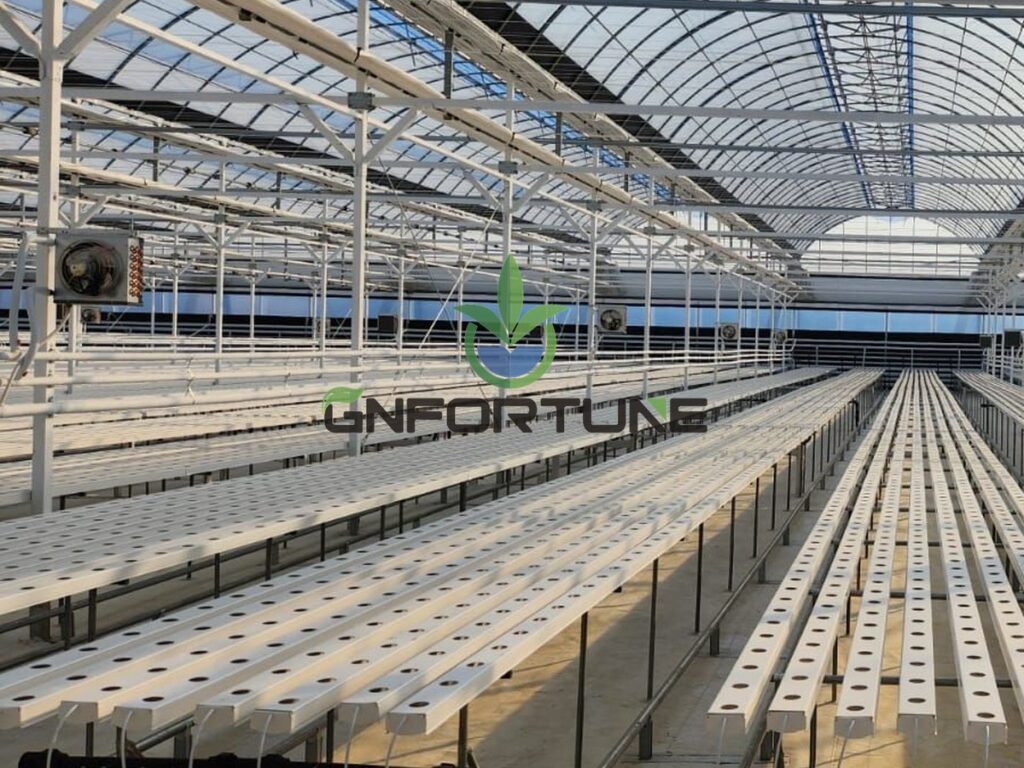
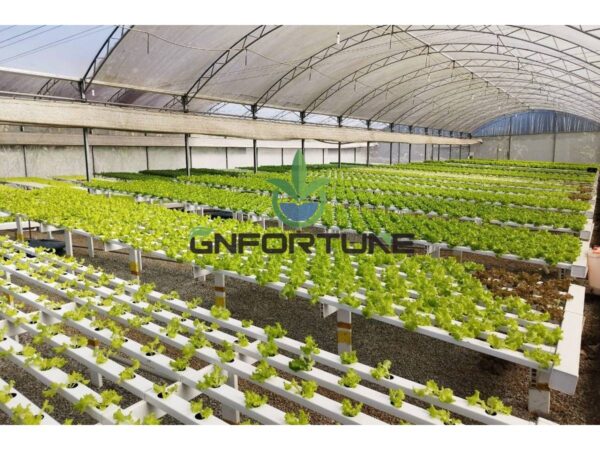
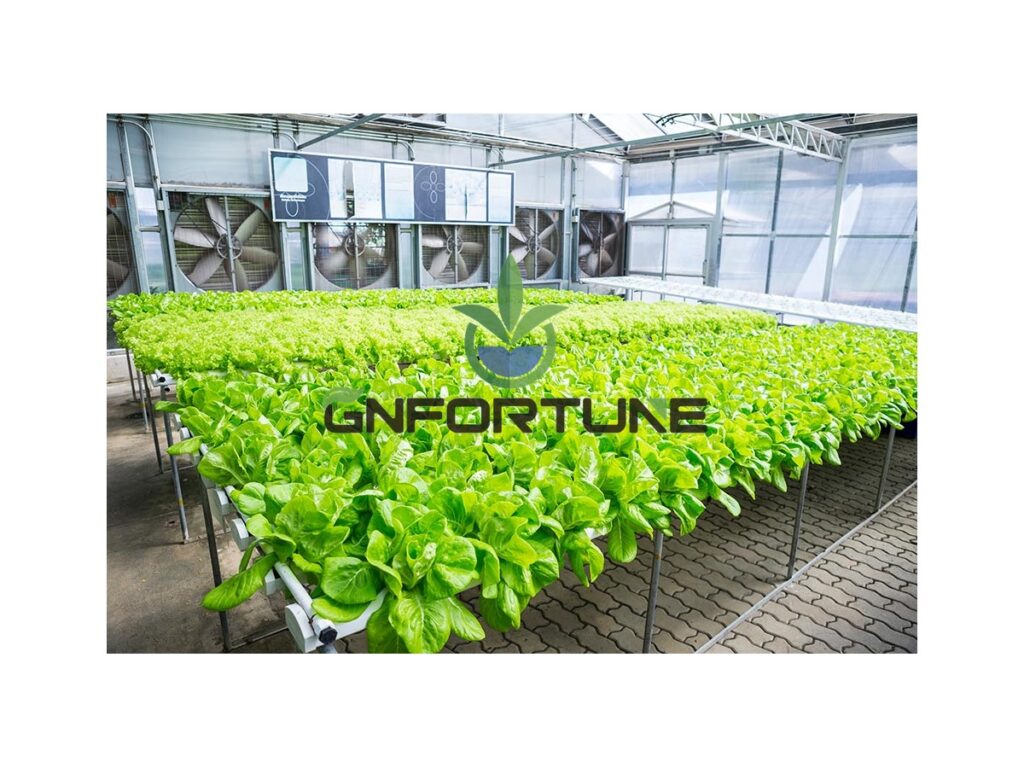
| Leafy lettuce, butterhead and mini | NFT | 25–45 | 8–12 crop turns per year, 20–30 plants/m², marketable head 150–250 g; assumes year-round production with temperature control and consistent transplant supply |
| Culinary herbs, cut and bunch | NFT / DWC | 25–60 | Repeated cuts, warm house, high planting density; range widens with cut-versus-whole-plant spec and with shelf-life limits to the market |
| Tomato, high-wire | Substrate gutter / Dutch bucket | 40–70 | Heated high-tech house, long season, CO₂ enrichment, disciplined crop steering and an experienced team; the upper half assumes supplemental light in low-radiation months |
| Cucumber, high-wire | Substrate gutter / Dutch bucket | 50–85 | Long season with two to three crop turns, high radiation, strong climate control and tight irrigation uniformity |
| Sweet pepper | Dutch bucket / substrate | 18–30 | Long single cycle, warm house, conservative plant load and careful generative steering; sensitive to temperature swings and to labour consistency |
These are planning ranges compiled for feasibility work, not performance guarantees for any particular farm. Validate them against local climate data, the cultivar’s own trial results and the market specification before they enter a financial model.

What moves a farm to the top or bottom of the range
Two farms with identical equipment land in different halves of the same range for reasons that are mostly managerial rather than technical. These are the variables worth writing into the model as explicit assumptions:
- Light and season length. Daily light integral and the number of productive months set the ceiling; no equipment recovers a short, dark season.
- Climate control capability. Heating, cooling, dehumidification and CO₂ decide how much of the year the crop spends near its optimum.
- Cultivar and market specification. A packout spec that rejects large or small fruit moves realised yield more than most growers expect.
- Plant density and spacing. Higher density raises hydroponic yield per square metre up to the point where light interception and airflow limit it.
- Water quality and nutrition. Source water sets what has to be treated before use; poor nutrition management shows up as cycle length, not as a single disaster.
- Pest and disease losses. Asymmetric — they hit the highest-value weeks hardest.
- Team consistency and downtime. Turnaround days, failed transplants and staff turnover are invisible in a yield table and decisive in practice.
Energy reliability belongs on the same list. A house that loses power during a heat wave or a cold snap loses more than the hours involved, and both monitoring and backup carry their own cost lines — see sub-metering electricity by zone and backup generator sizing for hydroponic farms.
Translating yield into revenue per cycle
Revenue is marketable kilograms multiplied by price, and both halves need scenarios. Work per cycle first — it matches how the farm actually operates — then roll up to the year.
An illustration with explicit assumed inputs: a 1,000 m² growing area of leafy lettuce at an assumed 4 kg/m² per cycle and 10 cycles per year gives 40,000 kg harvested; at an assumed 90% packout rate that is 36,000 kg marketable. Nothing in that calculation is a benchmark — the yield, cycle count and packout rate all have to be replaced with figures the farm can defend.
Price deserves the same treatment as yield. Model at least three levels — contract floor, expected average and spot downside — because price volatility often swings the result more than a yield assumption does. Where a crop is sold on contract, the volume commitment also constrains which crop mix the model is allowed to assume.
Labour and energy per kilogram
Two cost lines decide whether a yield number is worth chasing: labour hours per kilogram and energy per kilogram. A high-yield crop with much higher labour and heating per kilogram can return less than a modest-yield crop with a fast turn and low energy input.
- Labour. Dominated by transplant, harvest, pack and crop work. Hours per kilogram fall with scale, bench height, aisle width and how close packing sits to the crop — all layout decisions made before the first crop.
- Energy. Heating and supplemental lighting dominate where used; pumping and cooling dominate in hot climates. Measure it by zone and cycle, or the model allocates cost to the wrong crop.
Per-kilogram accounting connects both lines back to the yield assumption; the method is set out in cost per kilo: simple accounting for lettuce farms. Fertiliser handling belongs in the model too — storage and shelf life decide how much stock is written off, covered in farm fertiliser storage, segregation and shelf life.
How to use benchmarks in a bankable model
Build three cases and write the assumption next to every number. A model where the reviewer can trace each figure back to a stated condition is worth more than a model with tighter-looking output and no traceability.
- Set the area basis. Growing area from the layout drawing, with the structure footprint shown separately.
- Use the low end for the base case and the middle of the range for the upside, with the conditions for each written in the same row as the number.
- Add a ramp-up period. Farms do not reach steady state in cycle one; a common planning assumption is a ramp over the first two to four cycles as the team and the systems settle. Confirm against the crop and the team’s experience.
- Run sensitivity on the three variables that matter — price, packout rate and energy cost — rather than on everything at once.
- Include the end-of-life line where the site is leased. Decommissioning and relocation costs are real and frequently omitted; see decommissioning and moving a hydroponic farm.
- Date the model and name the sources. Benchmarks go out of date as cultivars and energy prices change; a revision date makes the model auditable.
FAQs About Hydroponic Yield Benchmarks
What yield number should go into a bank model?
The low end of the relevant planning range for the base case, with the middle used only for the upside. Write the assumptions beside the number, and replace it with local trial data once the farm has a season of its own.
Is hydroponic yield per square metre measured on greenhouse or growing area?
State which one is being used. Growing area excludes aisles, headlands, propagation and packing, so the two figures differ; mixing them is the most common error in early feasibility work.
Can a new farm hit the top of the range in year one?
Plan for a ramp instead. Most sites reach steady output after several cycles as the team, the irrigation balance and the crop programme settle, so the first year should carry an explicit ramp assumption.
Which crop gives the best margin?
It depends on the market and the local energy cost. High-yield vine crops carry higher energy and labour per kilogram and a longer cycle; short-cycle leafy crops turn faster but compete on price and logistics.
How much does system choice change the number?
System sets the ceiling and the labour profile rather than guaranteeing output. NFT suits short-cycle leafy production, while DWC and Dutch bucket suit long-cycle vine crops; the match between system and crop is what the benchmark assumes.
Related Reading
- Hydroponic Farm KPIs: Yield per m², Labour Hours and the Numbers That Run a Business — Farm KPIs: yield per m², labour hours and the numbers that run a business
- Most Profitable Hydroponic Crops: Yield, Price, and Demand — Yield, price and demand across the crops most farms compare
- Cost per Kilo: Simple Accounting for Lettuce Farms — Per-kilo accounting for turning a yield range into a margin
- Hydroponic Farm ROI: Cost per Acre & Payback Period — Cost per acre and payback period for the model this data feeds
- Crop Work Standards for Hydroponic Farms: Rates, Quality Criteria and Crew Training — Work rates, quality criteria and crew training behind labour per kilogram
Next Step: What to Send for a Quotation
Equipment pricing follows the production plan, not the other way round. A supplier can only size channels, tank volume, pumping and structure accurately when the crop mix, target tonnage and cycle plan are already stated — otherwise the quote is a range wide enough to be useless in a feasibility model.
For a project quotation, send: site or greenhouse dimensions and layout drawing, crop mix with target annual tonnage or cycles per year, growing area basis, local climate data and energy cost, water source analysis, level of automation required, target commissioning date and budget range. G AND N FORTUNE LIMITED supplies NFT, DWC, Dutch bucket and substrate gutter systems with 30 years of manufacturing behind them, a 5,000 m² factory and a 2,400 m² trial greenhouse, and quotes against project parameters rather than from a fixed price list.