If You Measure Yield per Plant, You Are Measuring the Wrong Thing
Hydroponic farms are capital-intensive, space-constrained and labour-heavy. The three numbers that determine profitability are output per square metre per year, labour hours per unit produced, and the percentage of what you grow that you actually sell. Plants per channel and grams per head are interesting; they are not management numbers.
This guide sets out the KPI set we recommend to commercial operations, realistic benchmark ranges by system, how to calculate each one without double counting, and a weekly reporting routine that takes an hour rather than a day. Pair it with the financial framing in our ROI and payback guide.
The Core Set: Twelve Numbers
| KPI | Formula | Why it matters |
|---|---|---|
| Yield per m² per year | Total saleable kg ÷ growing area m² ÷ years | The headline productivity metric; drives revenue per unit of rent or capital |
| Utilised area ratio | Growing area ÷ total greenhouse area | Exposes how much of your building actually produces |
| Crop turns per year | 365 ÷ days from transplant to harvest | Where most of the yield gain is available |
| Pack-out rate | Saleable kg ÷ total harvested kg | The fastest profit lever on most farms |
| Labour hours per kg | Total production labour hours ÷ saleable kg | Usually the largest controllable cost |
| Labour cost per kg | Production labour cost ÷ saleable kg | Combine with the above to see wage-rate and productivity separately |
| Cost per kg (all-in) | All operating costs ÷ saleable kg | The number that survives contact with a buyer’s price negotiation |
| Nutrient cost per kg | Fertiliser and acid cost ÷ saleable kg | Small in total, but a useful early-warning signal |
| Energy per kg | kWh ÷ saleable kg | Becomes dominant in heated and lit operations; see our energy guide |
| Water per kg | m³ consumed ÷ saleable kg | Matters for permit compliance as well as cost |
| Downtime hours | Hours with any zone out of specification | The leading indicator nobody tracks until it hurts |
| Plan attainment | Actual kg ÷ planned kg | Tells you whether your planning or your production is the problem |
Realistic Benchmarks by System

| System and crop | Yield, kg/m²/year | Labour, hours/kg | Notes |
|---|---|---|---|
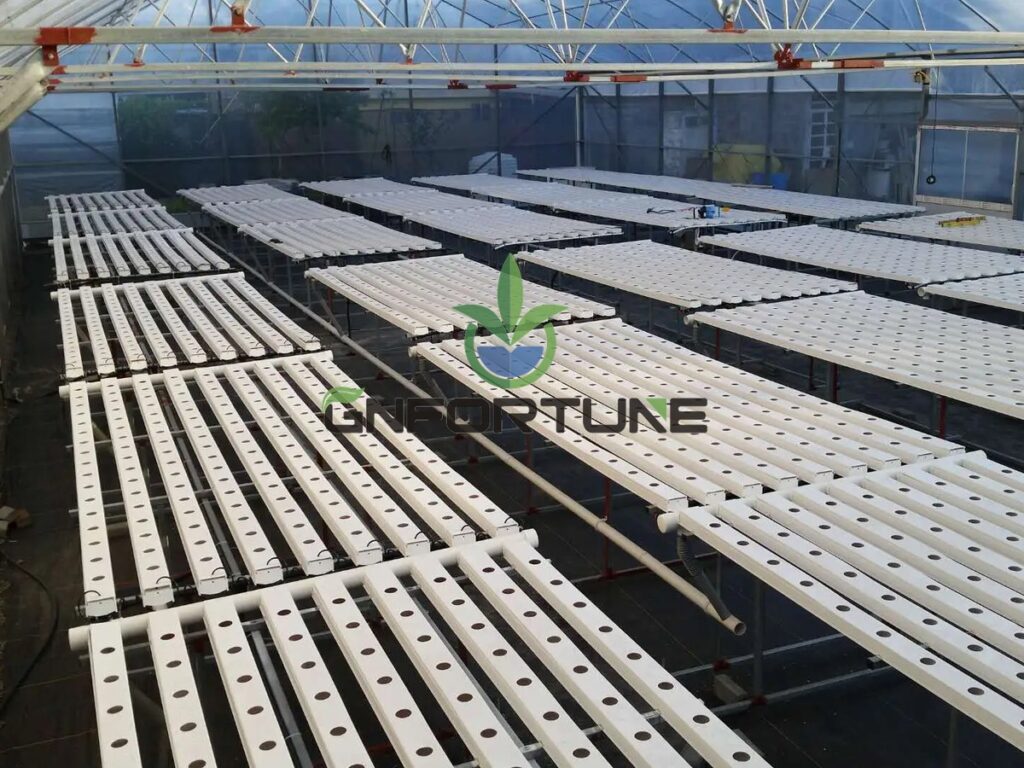
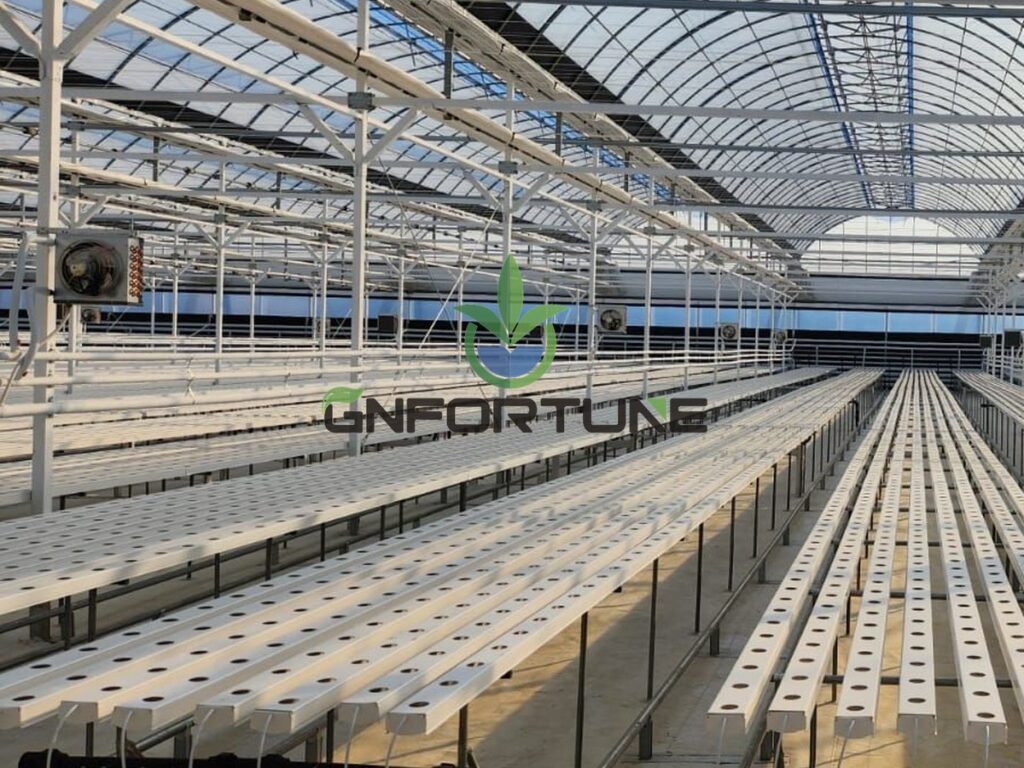
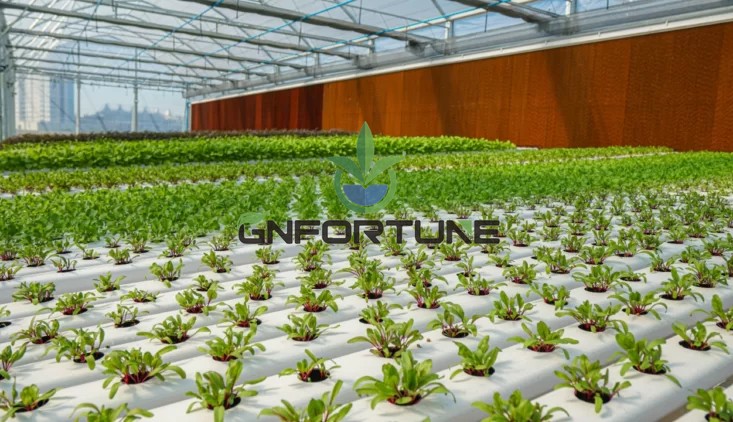
| NFT leafy greens | 35–60 | 0.05–0.12 | Highly dependent on crop turns and level of packing automation |
| DWC / raft lettuce | 30–50 | 0.06–0.15 | Lower density than NFT, simpler hydraulics |
| Dutch bucket tomato | 40–70 | 0.10–0.20 | Labour dominated by pruning, trellising and picking |
| Dutch bucket cucumber | 50–80 | 0.08–0.15 | High frequency picking; labour peaks are management-critical |
| Strawberry gutter | 12–25 | 0.20–0.40 | Most labour-intensive of the common crops |
| Vertical tower leafy greens | 60–120 per m² of floor | 0.05–0.14 | Quoted per floor area; per-lit-area productivity is much lower |
| Herbs, cut-and-come-again | 20–40 | 0.10–0.25 | Multiple harvests from one planting |
| Microgreens | 15–30 | 0.15–0.35 | Short cycle, high labour and packaging content |
These are working ranges for competent operations, not best-case marketing figures. If your numbers sit well below them, the cause is almost always one of three things: crop turns lower than planned, pack-out lower than assumed, or labour productivity below the level the layout was designed for.
Getting the Definitions Right
- Define growing area once and never change it — including whether aisles, propagation and plant rooms are in or out. Most KPI arguments are actually definition arguments
- Saleable means packed and accepted. Counting harvested-but-rejected product hides the single biggest loss on many farms
- Count contractor and casual labour. Seasonal picking labour is real cost even when it is not on the payroll
- Allocate shared costs consistently. If you run multiple crops, agree the allocation basis and keep it stable year to year
- Separate plan attainment from yield. A good yield against a bad plan is still a planning failure
- Use rolling averages. Weekly numbers are noisy; a four-week rolling average tells you whether a change worked
The Weekly Reporting Routine
| Frequency | Review | Owner |
|---|---|---|
| Daily | Harvest kg by zone, pack-out rate, downtime events, alarm history | Grower / shift lead |
| Weekly | Labour hours and hours/kg, plan attainment, energy and water per kg, discard reasons | Farm manager |
| Monthly | Cost per kg, yield per m² rolling, nutrient and consumables cost, maintenance spend | Farm manager / finance |
| Quarterly | Crop mix and pricing review, benchmark against plan, capex and improvement list | Owner / board |
| Annually | Full cost and margin by crop, replan the crop calendar, re-baseline the KPI targets | Owner / board |
Keep the weekly dashboard to one page. If a number does not change a decision this week, it belongs in the monthly pack. Farms that build forty-metric dashboards usually stop looking at them within two months.
Using KPIs to Find the Actual Problem
| Symptom | Where to look first |
| Yield per m² below plan | Crop turns achieved, then transplant losses, then cycle length |
| Good yield, poor margin | Labour hours/kg and pack-out rate |
| Labour hours rising | Layout and workflow, then staff turnover and training, then yield |
| Pack-out falling | Harvest timing, cold chain, and grading consistency |
| Energy per kg rising | Heating or lighting hours, then equipment efficiency, then utilisation |
| Nutrient cost per kg rising | Dosing calibration, dump frequency, drain-to-waste fraction |
| Downtime rising | Maintenance compliance, spares availability, alarm response |
FAQ
What is a good yield per square metre for a hydroponic farm?
Expect 35–60 kg/m²/year for NFT leafy greens, 40–70 kg/m²/year for Dutch bucket tomato and 50–80 kg/m²/year for cucumber. Vertical systems quote 60–120 kg per m² of floor area because they stack growing surfaces.
Which KPI should a new farm watch most closely?
Pack-out rate and labour hours per kg. Both move quickly, both expose operational problems early, and together they usually explain most of the gap between a projected and an actual margin.
How do I calculate cost per kg properly?
Divide all operating costs — labour, energy, water, nutrients, consumables, packaging, maintenance, overheads — by saleable kilograms, not harvested kilograms. Using harvested volume hides rejection losses and flatters the number.
How many crop turns per year should I plan for?
Divide 365 by the days from transplant to harvest, then subtract turnaround time for cleaning and replanting. Leafy greens typically allow 8–14 turns; fruiting crops run as one or two long cycles per year.
What is a reasonable labour figure for a hydroponic farm?
0.05–0.12 hours per kg for automated leafy greens, 0.10–0.20 for tomato, and 0.20–0.40 for strawberry. Higher figures usually indicate a layout or workflow issue rather than a performance issue.
How often should KPIs be reviewed?
Daily for harvest, pack-out and downtime; weekly for labour and plan attainment; monthly for full cost per kg. Keep the weekly dashboard to one page and use four-week rolling averages to judge improvement.
Get Your Numbers Benchmarked Against Comparable Farms
Send your crop mix, growing area, labour structure and current output through the quote form. Our team will return a KPI set with benchmark ranges for your system, a one-page weekly dashboard template and the priorities we would address first.