

The Question Behind Every Water Bill and Every EC Problem
Should the solution go round again, or should it go to drain? It sounds like an environmental question and it partly is, but on a commercial farm it is really a question about control: recirculation lowers water and fertiliser cost and hands you a more complex chemistry set to manage. Drain-to-waste buys stability at the price of volume.
Most farms end up somewhere in the middle, and most never write down where. This guide gives you the decision framework, the numbers that drive it, the drift patterns to watch, and the daily and weekly routines that keep a recirculating system stable for months rather than weeks.
Recirculation vs Drain-to-Waste: The Real Comparison
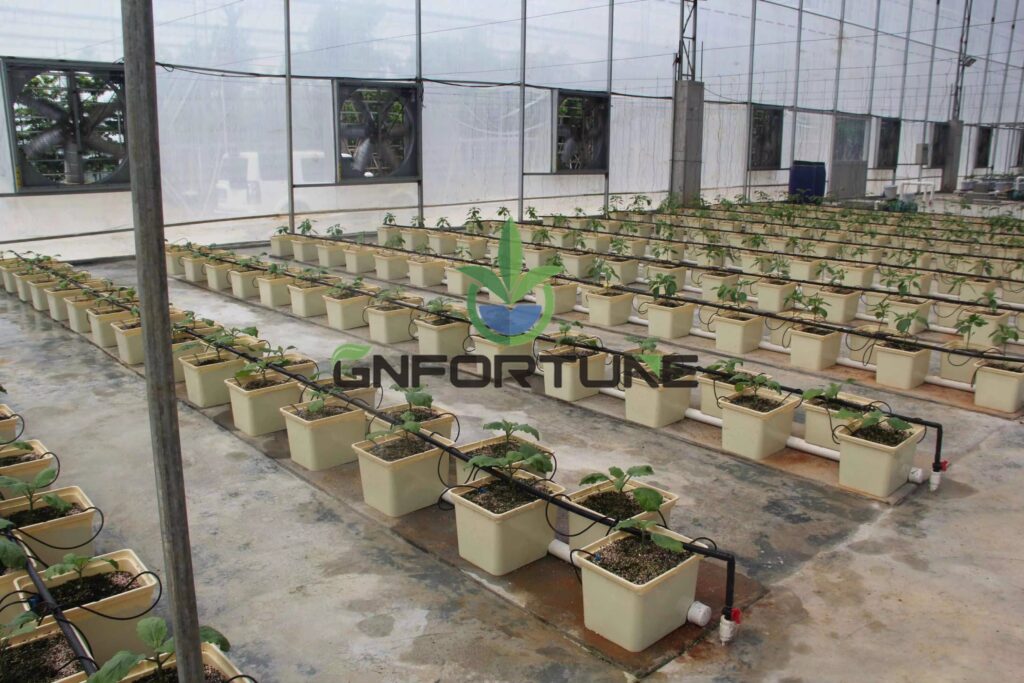
| Factor | Recirculating | Drain-to-waste |
|---|---|---|
| Water use | 70–90% less than open systems | High; often 20–40% runoff fraction |
| Fertiliser use | 20–40% saving in practice | Full dose consumed or lost |
| Root-zone stability | Drifts over time; needs management | Always equals the fresh mix |
| Pathogen spread | One infected plant reaches the whole loop | Limited to the emitter zone |
| Discharge obligations | Concentrated waste stream at dump | Continuous dilute discharge |
| Capital cost | Return lines, collection, treatment, sterilisation | Simpler, but bigger water supply and drainage |
| Where it wins | Water-scarce regions, high fertiliser cost, tight discharge rules | Poor source water, high disease pressure, short-cycle crops |
The decisive variable is usually source water quality. With clean rainwater or good reverse-osmosis permeate, recirculation is straightforward. With water high in sodium, chloride or bicarbonate, every pass concentrates what the crop does not take up, and the loop becomes a salinity management problem. Start from a full water analysis — our water treatment guide sets out the treatment options — and be honest about the discharge rules in your area before choosing.
Reading EC Drift: What the Number Is Telling You
In a recirculating system the EC you set is not the EC the crop sees three days later. Total EC rises when the crop takes up more water than salt, and falls when it takes up more salt than water. Both are normal; the direction tells you which.
| Observation | Interpretation | Action |
| EC rising, pH falling | Crop taking up more water than nutrients; high transpiration | Dilute with fresh water, check VPD and irrigation frequency |
| EC falling, pH rising | Crop taking up more nutrients than water | Strengthen the feed, check for excessive irrigation volume |
| EC rising, pH rising | Alkaline source water or bicarbonate accumulation | Acid dose, review water pre-treatment |
| Total EC stable but crop shows deficiency | Ratio drift — one ion depleted while others accumulate | Solution analysis, partial refresh |
| EC rising steadily with no weather change | Leak, evaporation, or dosing error | Check tank level trend, verify injector calibration |
Ratio Drift: The Failure Mode EC Cannot Show You
Total EC is a conductivity reading. It cannot tell you which ions are present. In a loop, the crop removes nutrients in its own ratio, and the make-up solution is added in a different ratio, so composition drifts even when total EC looks perfect.
- Common accumulators: sodium, chloride, sulphate, and bicarbonate in hard-water regions
- Common depletions: potassium at fruiting, phosphorus in cool root zones, iron at high pH, and micronutrients in high-growth weeks
- Send a solution sample for analysis every 2–4 weeks on a recirculating system, and compare against your fresh mix rather than against a generic target
- Correct by adjusting the make-up recipe, not by dumping — a partial refresh of 20–30% plus a recipe correction usually resolves drift within a week
- Keep a running log. The trend line matters more than any single analysis, and it is the first thing a good agronomist will ask for
When to Dump: Triggers, Not Calendars
A fixed six-week dump cycle is a habit, not a control strategy. Set triggers and dump when one fires.
| Trigger | Threshold | Response |
|---|---|---|
| Sodium accumulation | Above roughly 50–70 mg/L in the loop, crop-dependent | Partial or full refresh |
| Chloride accumulation | Above 100–150 mg/L | Refresh; check source water and any sanitiser |
| Ratio imbalance | Any major nutrient out of balance despite recipe correction | Full dump and restart |
| Pathogen detection | Positive test for Pythium or similar in the loop | Dump, sanitise, and review filtration — see our root rot guide |
| Turbidity / biofilm | Visible or measured increase in suspended solids | Filter review plus refresh |
| Crop change | End of crop cycle | Full dump, clean, sanitise |
Sanitation Inside the Loop
If you recirculate, you have committed to treating the returning solution. Choose one primary method and understand its interactions.
| Method | What it removes | Watch for |
|---|---|---|
| Sand or disc filtration | Suspended solids, root debris | Backwash volume and disposal; pressure drop as it loads |
| UV sterilisation | Bacteria, fungi, viruses in transit | Dose rate at actual flow; quartz sleeve fouling; no residual protection |
| Ozone | Broad-spectrum oxidation | Off-gassing, material compatibility, worker safety |
| Heat treatment | Everything at sufficient temperature and contact time | Energy cost; needs heat recovery to be viable |
| Slow sand / biofilter | Organic load, some pathogen suppression | Space, start-up time, maintenance |
Daily and Weekly Routines
- Daily: EC and pH at the tank and at the furthest emitter; tank level; filter differential pressure; irrigation volume per zone; any alarm history
- Daily: visual root check at a fixed sample of inspection points — same plants, same time, logged
- Weekly: injector calibration check; drip emitter output test at head, middle and tail of a row; solution temperature log review
- Monthly: full solution analysis; drain line inspection; tank and channel cleaning; UV lamp hours and sleeve condition
- Per crop: full dump, clean, sanitise, and requalify the loop before replanting
For mixing practice and tank arrangement, see our A and B tank guide; for the control hardware that automates the corrections, see the auto-dosing buyer’s guide.
FAQ
Is recirculation or drain-to-waste better for a commercial farm?
Recirculation saves 70–90% of water and 20–40% of fertiliser and is usually preferred where water is scarce or discharge is regulated. Drain-to-waste is safer when source water is poor, disease pressure is high, or the crop cycle is short and simple.
How often should I dump a recirculating nutrient tank?
Use triggers rather than a calendar: sodium or chloride accumulation, an uncorrectable ratio imbalance, a positive pathogen test, or the end of a crop cycle. Many well-run farms operate six to twelve weeks between full dumps with partial refreshes in between.
What causes EC to rise even when I am not adding fertiliser?
The crop is taking up water faster than nutrients during high transpiration, concentrating the remaining salts. Dilute with fresh water and check that irrigation frequency matches the VPD, rather than lowering the feed strength.
Can I mix recirculation and drain-to-waste on one farm?
Yes, and it is common: recirculate the zones with clean source water and high-value crops, run drain-to-waste on propagation or on zones fed from a marginal water source. Keep the two loops physically separate with their own dosing and drainage.
What discharge rules apply to hydroponic runoff?
It varies by jurisdiction and can apply to volume, nutrient concentration or both. Confirm the local permit position during design, because a treatment or holding requirement discovered at commissioning is one of the most expensive late changes on a project.
Get the Management Plan Written Before Planting
Send your system type, source water analysis, crop plan and local discharge rules through the quote form. Our team will return a recirculation decision, a make-up recipe starting point, dump triggers, a sanitation configuration and a daily-to-monthly control schedule.