A buyer does not ask how well the crop is growing; the buyer asks what arrives next Tuesday, and at what weight and grade. Production forecasting is the discipline that answers that question from data instead of optimism: transplant dates, cycle times, area, density and history combined into weekly quantities that a farm can actually deliver. The planting calendar and the yield benchmark tables are the raw inputs — both covered elsewhere — while this article covers the forecasting method itself: the chain from transplant date to promised kilos, the corrections that keep it honest, and the margin that separates a commitment from a hope.
What a Production Forecast Actually Promises
A forecast is a statement of three things at once: quantity (kilos or units per week), timing (which weeks they ship) and quality (grade and spec). Customers build their own plans on all three, so a forecast that delivers the right tonnage in the wrong weeks, or the right weeks at the wrong grade, still counts as a miss. This is why forecasting starts from the crop’s biology and ends in the sales conversation — the numbers must survive both.
The distinction between an internal plan and an external commitment matters throughout. The internal plan is the best estimate of what the crop will do; the external commitment is what you tell the customer, and the two are separated deliberately by a margin. Farms that skip the separation promise the best case and live in the miss column.
The Chain: From Transplant Date to Harvest Date
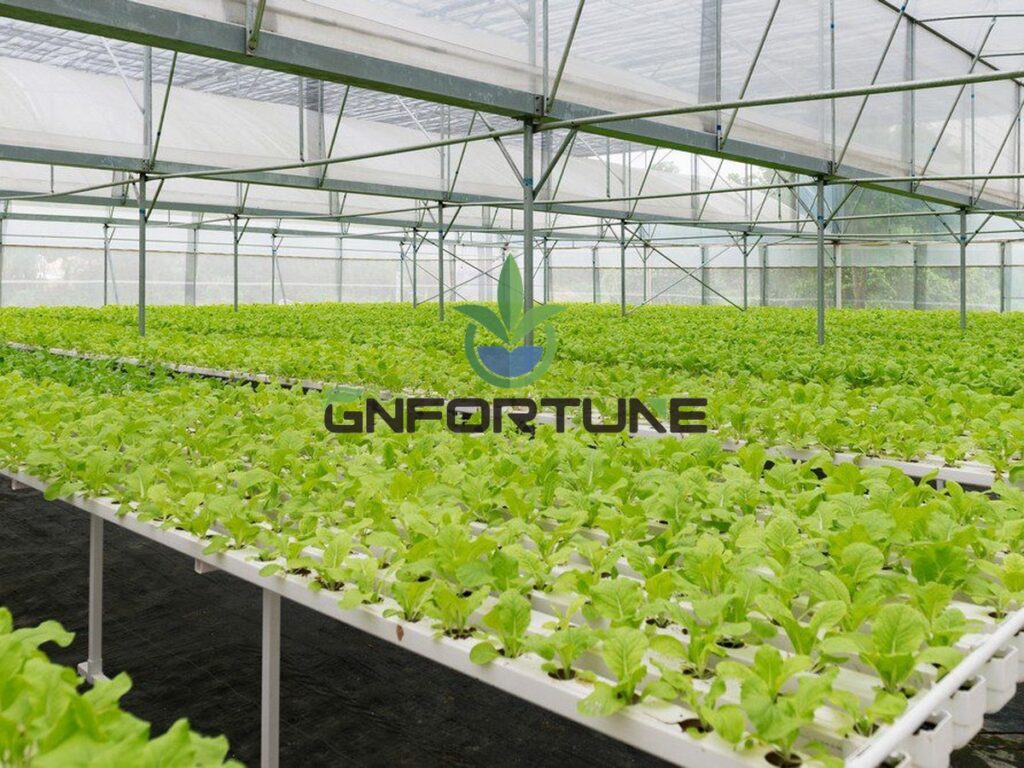
The first link is timing arithmetic. Every crop on a farm has a cycle time — transplant to first harvest — plus, for cut-and-come-again and multi-pick crops, a harvest window. Cycle time is not constant: it flexes with season, light and variety. As planning ranges for orientation only, butterhead lettuce in NFT runs roughly 30–40 days transplant to cut in warm, bright conditions, stretching toward 45–55 days in the low-light winter months with cooler root zones; basil and other warm herbs behave similarly on the warm side, assuming normal EC and adequate flow. The exact numbers come from the farm’s own records, which is why forecast quality improves with every logged cycle.
The chain works both ways at once: a promised delivery week sets the latest transplant date and the sowing date before it, while every batch currently in the house is future supply landing in specific weeks. A farm that tracks each batch — area, variety, expected harvest window — has a rolling forecast that updates itself weekly as batches advance. The gap days between cycles belong in the arithmetic, not in invisible slack.
Converting Benchmarks Into Kilos Per Week
The second link converts biology into commerce. The working formula is plain: harvestable area per week times expected yield per square metre equals expected output, adjusted for loss. Each input has a defined source and a defined failure mode:
- Harvestable area per week: read from the batch schedule — actual planted area reaching harvest in that week, net of the replanting that follows skips and losses.
- Yield per square metre: taken from the farm’s own trailing history first, and from benchmark tables only for new crops without history. Benchmarks describe what well-run systems achieve, not what any specific farm will.
- Loss allowance: the share that never reaches spec — disease culls, off-grade heads, harvest damage, packing rejects. A planning approach is to forecast saleable output on top of a measured loss rate, not gross yield minus a guess.
A worked illustration with assumed figures: a bay holds 1,000 m² of lettuce at roughly 16 plants per m², cutting 250 g saleable heads, giving a gross potential of about 4 tonnes per full cycle. Staggered transplanting spreads that across four weekly cuts of roughly 1 tonne gross; at a measured 8–12% loss, the saleable forecast per week is around 880–920 kg. The exact figures vary by system and season — the method is what transfers.
Adjusting for Season, Light and History
Two corrections separate a usable forecast from a spreadsheet. The first is the light ceiling: in low-light months, cycle time lengthens and per-metre yield falls together, so winter forecasts need both adjustments — applying only the longer cycle overstates output. Accumulated light records predict this better than calendar dates.
The second correction is historical variance. A forecast built on the average of twelve past cycles will miss in both directions; a forecast built on the average minus one standard deviation of those cycles will miss rarely. For a number being promised to a customer, the second definition is the honest one. KPI tracking — yield per m², loss rate, cycle time by season — is the data discipline behind this, and the KPI article defines the set worth keeping.
Buffering the Promise: Safety Margins and Communication
The margin between forecast and commitment is a management decision with a structure to it, not a shrug:
- Commit a share of the forecast, not all of it. A planning range is to commit roughly 90–95% of the forecast volume to firm orders, assuming stable crops and a season with history behind it; commit less in new-crop, new-house or winter-light conditions.
- Hold the reserve where it is flexible. The uncommitted share belongs to spot sales or to covering the week’s misses — not to a second firm customer who then becomes a second miss.
- Re-forecast weekly and tell people early. The rolling view updates as batches grow; the moment a week looks short, the affected customer hears it with the reason and the recovery plan. Off-take and supply agreements usually carry the formal side of this, and early notice is what keeps a shortfall a conversation rather than a claim.
- Log the misses and their causes. Every shortfall feeds the loss allowance and the variance data, which is how the margin tightens over time without becoming reckless.
The Inputs That Make or Break the Forecast
Forecast quality is input quality. The table below lists the working inputs, where each comes from and the way each typically fails — the audit list for any forecast that has started missing.
| Input | Source | Common failure |
|---|---|---|
| Cycle time by crop and season | Own logged cycles, at least one full year | Using summer speed for winter crops |
| Yield per square metre | Trailing farm history; benchmarks only for new crops | Building on benchmark optimism without history |
| Loss rate | Measured culls and packing rejects by month | A single flat guess applied to all seasons |
| Planted area reaching harvest | Batch schedule with replanting tracked | Counting planned area, not area that survives to harvest |
| Light and temperature outlook | Site history; accumulated light records | Calendar dates without a seasonal correction |
| Commitment margin | Policy set by management | Committing 100% of forecast in every season |
Production forecasting is not a finance exercise bolted onto the greenhouse; it is the crop schedule translated into the language of the sales ledger. Farms that run it — batches forward-viewed weekly, yields from history, commitments below forecast — stop selling hope and start selling a number that arrives.
FAQs About Production Forecasting
How far ahead can a hydroponic farm realistically forecast?
As far as its transplant schedule reaches, because each batch is a known quantity from the day it is sown. Leafy greens give roughly four to six weeks of reliable forward visibility, assuming normal germination; beyond that, forecasts are plans, not commitments, and should be labelled as such when shared.
Should we forecast from yield benchmarks or our own history?
Own history wherever it exists, because it already contains your climate, system and loss rate. Benchmarks are the starting point for crops without history and a sanity check against it; building commitments directly on benchmark numbers usually overstates output.
How big should the gap between forecast and commitment be?
A planning range is to commit about 90–95% of forecast volume in stable seasons, assuming a year of cycle history; commit less for new crops, new houses or the winter-light period. The right size is whatever makes misses rare and small, and it should tighten as the data improves.
What single input breaks forecasts most often?
Cycle time applied out of season. A summer transplant-to-harvest speed stretched into winter without a light correction understates every harvest window downstream, and the error compounds across the whole batch ladder. Seasonal cycle tables fix most of it.
How do we handle a week that is already going to miss?
Re-forecast immediately, notify the affected customer with the reason and the recovery path, and protect the following weeks by not over-committing them to compensate. The recovery matters less than the early notice, which is what preserves the account through a bad week.
Related Reading
- Crop Scheduling for Continuous Production — The planting calendar the forecast is built on
- Yield Benchmarks by Crop and System — Starting numbers for crops without history
- Hydroponic Farm KPIs: The Numbers That Run a Business — The records that make each forecast sharper
- Offtake Agreements Before You Build — The formal commitments the forecast must serve
- Crop Turnaround: The Window Between Two Cycles — The gap days the arithmetic must include
Next Step: What to Send for a Quotation
Forecast accuracy is set by system uniformity as much as by scheduling: uneven zones and mixed setups produce uneven weeks. When a farm is designed around a predictable output, forecasting becomes arithmetic instead of apology.
Planning a farm around a committed weekly output? For RFQ or project consultation, send: target crop and weekly volume you plan to promise; available growing area and number of zones; system type and channel section; local climate records and season profile; whether staggered transplanting is planned from day one; sales channels and contract commitments held; delivery schedule; and the budget band. G AND N FORTUNE LIMITED supplies NFT channels, DWC and substrate systems quoted to those parameters, with layouts designed for even weekly production.