

Honest version first: hydroponic farm ROI is not created by the equipment — it’s created by your market price, your labor cost and your operating discipline, and then protected by the equipment. Anyone selling you a system with a payback promise before knowing your local produce prices is guessing. What we can do honestly is show you the framework: what an acre actually costs to equip, what it can produce, where the operating money goes, and the three levers that move payback from 10 years to 3.
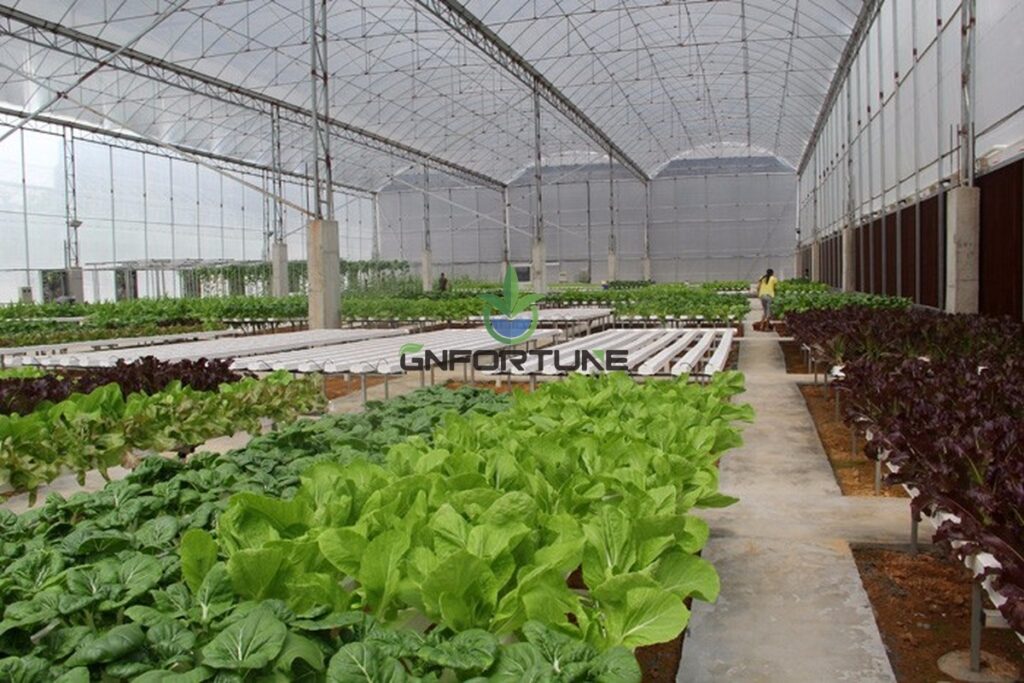
What an Acre Costs to Equip
An acre is ~4,000 m². For a leafy-greens NFT operation, the all-equipment budget lands roughly here:
| Scope | Budget band (USD) | Notes |
|---|---|---|
| NFT system equipment | $80,000–160,000 | Channels, stands, irrigation, dosing, pumps — per the cost guide |
| Greenhouse structure (if new) | $120,000–350,000+ | The dominant line — film vs polycarbonate vs glass moves it most |
| Utilities & site works | $20,000–80,000 | Power, water, floor, drainage — the forgotten budget |
| Working capital, season 1 | $30,000–60,000 | Seed, nutrient, labor, packaging before first revenue month 3–4 |
The single most common planning error: budgeting the equipment and forgetting the bottom three rows. The greenhouse and site lines frequently exceed the hydroponic equipment itself, and season-1 working capital has ended more farms than any crop disease.
What an Acre Produces
Conservative production math for 4,000 m² of NFT lettuce (usable growing area, not floor area):
- Annual output: roughly 0.6–0.9 million heads at 8–10 cycles, single-level; multi-tier raises this 40–80% with matching power costs
- Weekly harvest rhythm: staggered planting turns the acre into a weekly cash engine rather than seasonal lump income
Ton-for-ton comparisons with field agriculture flatter hydroponics less than consistency comparisons: year-round supply at stable quality is what earns the premium pricing that makes the ROI work.
Where the Operating Money Goes
| Cost line | Share of annual opex (typical) | Control lever |
|---|---|---|
| Labor | 30–45% | Harvest ergonomics, staggered scheduling, training |
| Power | 15–30% | Pump scheduling, insulation, LED only where needed |
| Nutrients & seed | 10–15% | Bulk buying, dosing accuracy |
| Packaging & logistics | 10–20% | Local market radius — freight kills distant sales |
| Maintenance & consumables | 5–10% | Spares kit, probe calibration, scheduled rebuilds |
Note what’s not on top: water. Hydroponic recirculation cuts irrigation water 70–90% — real money in dry regions, but rarely the decisive line. The decisive lines are labor and your selling price.
The Three Levers That Actually Move Payback
- Your selling price and contract structure. A farm selling washed, packed lettuce under a standing contract with a distributor earns a different multiple than the same farm selling at a spot wholesale market. Secure your price before you pour the floor.
- Labor design. At harvest, waist-height NFT picking runs roughly twice as fast as stooped field work. Multiply that by every harvest day and your biggest opex line shrinks structurally — this is where NFT’s capital cost converts into ROI.
- Energy cost and reliability. Cheap reliable power makes everything work; expensive or unreliable power forces redundancy spending (generators, cooling) that must be in the model from day one. In hot climates, reservoir cooling is not optional equipment — it’s the price of staying in business.
A reality we tell every investor group: payback forecasts built on “best-in-class” yield assumptions and top-of-market prices come out at 2–3 years. Forecasts built on conservative yields and mid-market pricing come out at 4–6 years. The farms still standing in year 5 are the ones that funded themselves on the conservative model and treated the upside as a bonus. Model the conservative case.
A Worked Payback Example
| Line | Conservative | Optimistic |
|---|---|---|
| Equipment (1,000 m² NFT) | $35,000 | $35,000 |
| Annual revenue | $75,000 | $110,000 |
| Annual opex | $52,000 | $60,000 |
| Annual net | $23,000 | $50,000 |
| Equipment payback | ~1.5–2 yrs | < 1 yr |
These are equipment-scope numbers — add greenhouse and site capital for the true project payback. The point of the table is the sensitivity: revenue assumptions ±30% swing the payback more than any equipment discount you’ll ever negotiate. Push your supplier on price, but push your market research harder.
FAQ
Is hydroponic farming profitable?
A: It’s a business, not a machine — profitable farms share disciplined cost control and secured markets; unprofitable ones usually overbuilt capital or never validated their price. The equipment is rarely the deciding factor.
What payback should I model?
A: 3–5 years on full project capital using conservative assumptions. Anything faster than that in a model means an assumption is doing heavy lifting — find it.
Does a bigger farm improve ROI?
A: Scale improves unit economics (equipment tiers, labor efficiency) but adds logistics distance and management complexity. Size to your market, not to your ambition.
Model Your Project Honestly
Send crop plan, scale and destination through the quote form — you’ll get an itemized equipment quote you can drop straight into your own ROI model, with no obligation.